IPython Notebooks
Nonrigid Registration of 2D Face Images
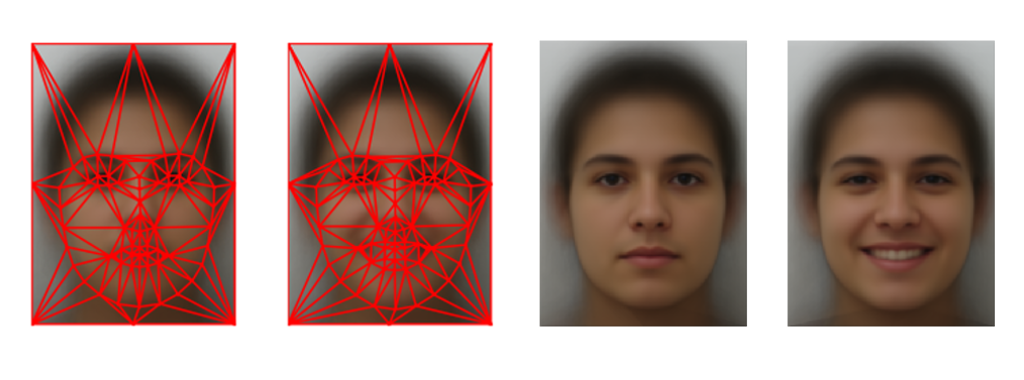
Similarity and Affine Transformations of 2D Face Images
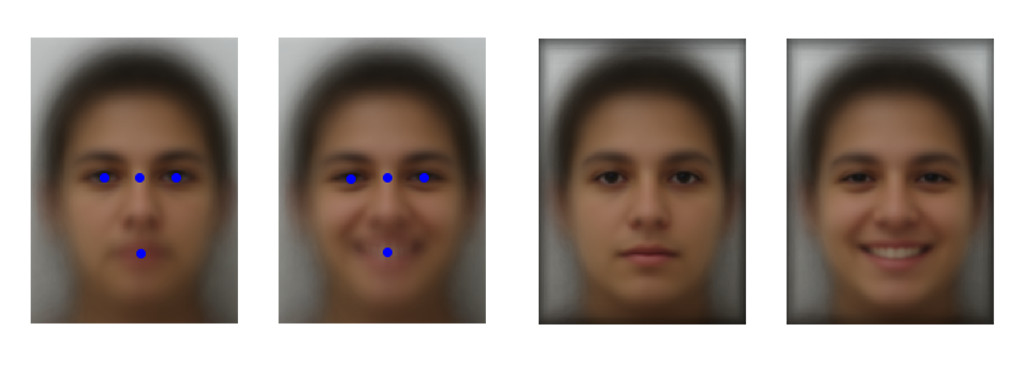
Automatic Facial Landmarks Annotation
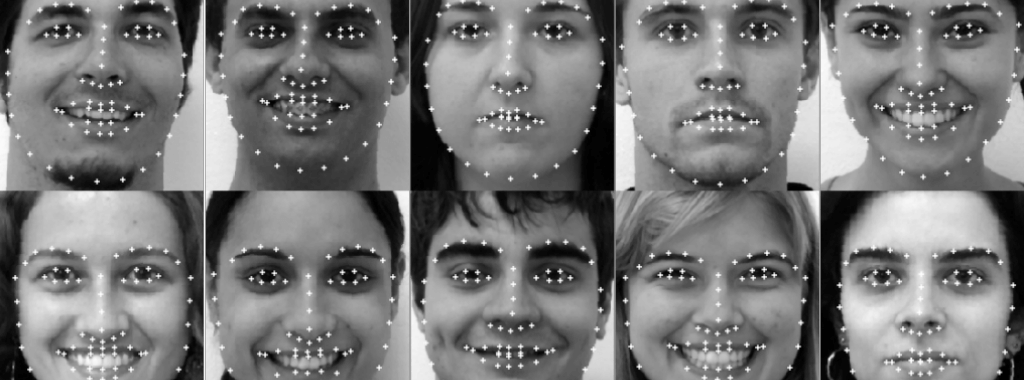 Facial landmarks are an additional information that spatially and geometrically represents the most important features in a face, such as the position of the eyes, nose and mouth as well as the shape of the face. When we talk about image processing, this information is quite helpful to align an image, since the coordinates for these features let us measure tha angle and distance of each eye, for example. Read more
Visualizing PCA on Face Images
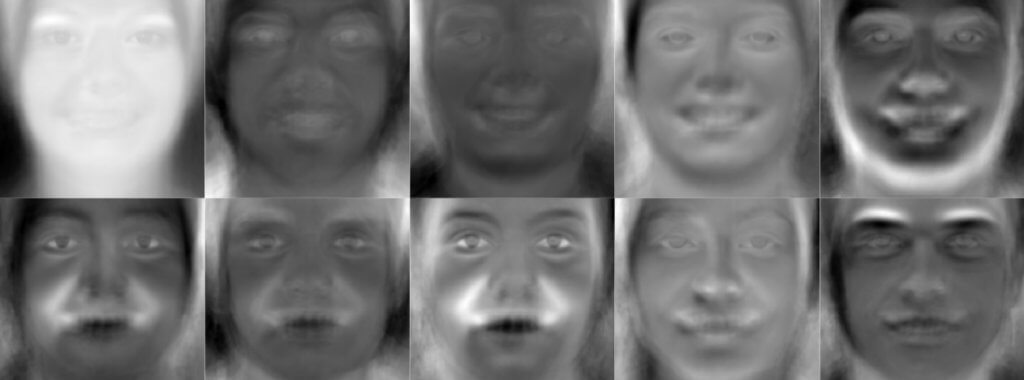 The initial purpose of this tutorial was to introduce my colleague, whos a college sophomore in Engineering, an intuitive feeling for Dimensionality Reduction techniques and how to visualize it. I could choose the well-known iris dataset to do this, but I decided to work with data belonging to a much higher feature space - images. 75000 dimensions to be exact. Read more
Plotting 3D Search Spaces
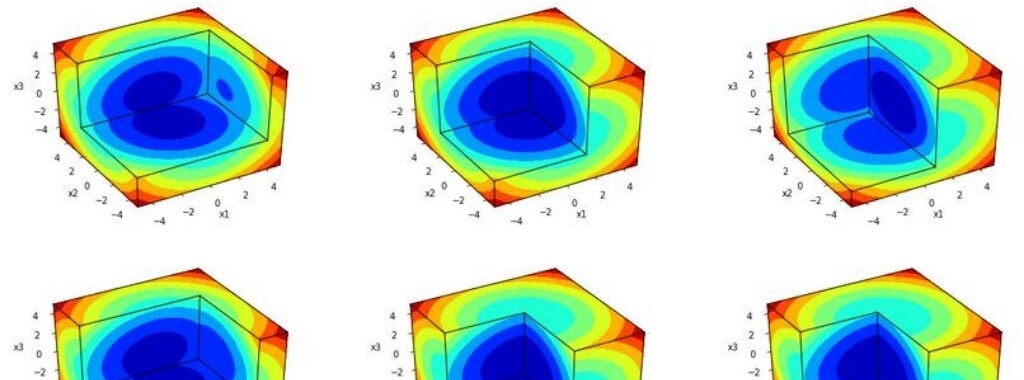 As I was making progress on my Master’s thesis, I needed to figure a way to show visualizations of functions with 3 variables, so I created a Python script that allows me to visualize it using contour surfaces. This is a tutorial showing how I implemented this Python script and how it helped me gain insights about a function that would otherwise be extremely hard to visualize. Read more
Color Map Effects on Face Images
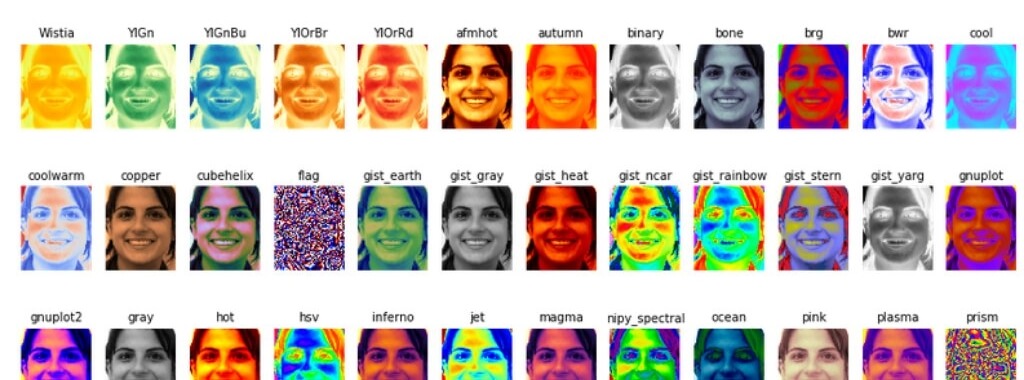 As soon as you get some data, you may want to create a plot and see what it looks like. You may even want to share your findings with your colleagues in a way that is easiest for them to understand. For these reasons, you will eventually need to choose the colors for you plot in order to summarize some information. A pre defined set of colors is called a color map, or cmap for short. Read more